Written by Cecilia Bergman
Visual thinking is an important skill for marketers and consultants. We can use it to reflect on ideas, figure out a scope of work, or organize insights from research. It’s also handy for presentations and workshops when you need to break down complex ideas quickly and align on a concept or plan of action.
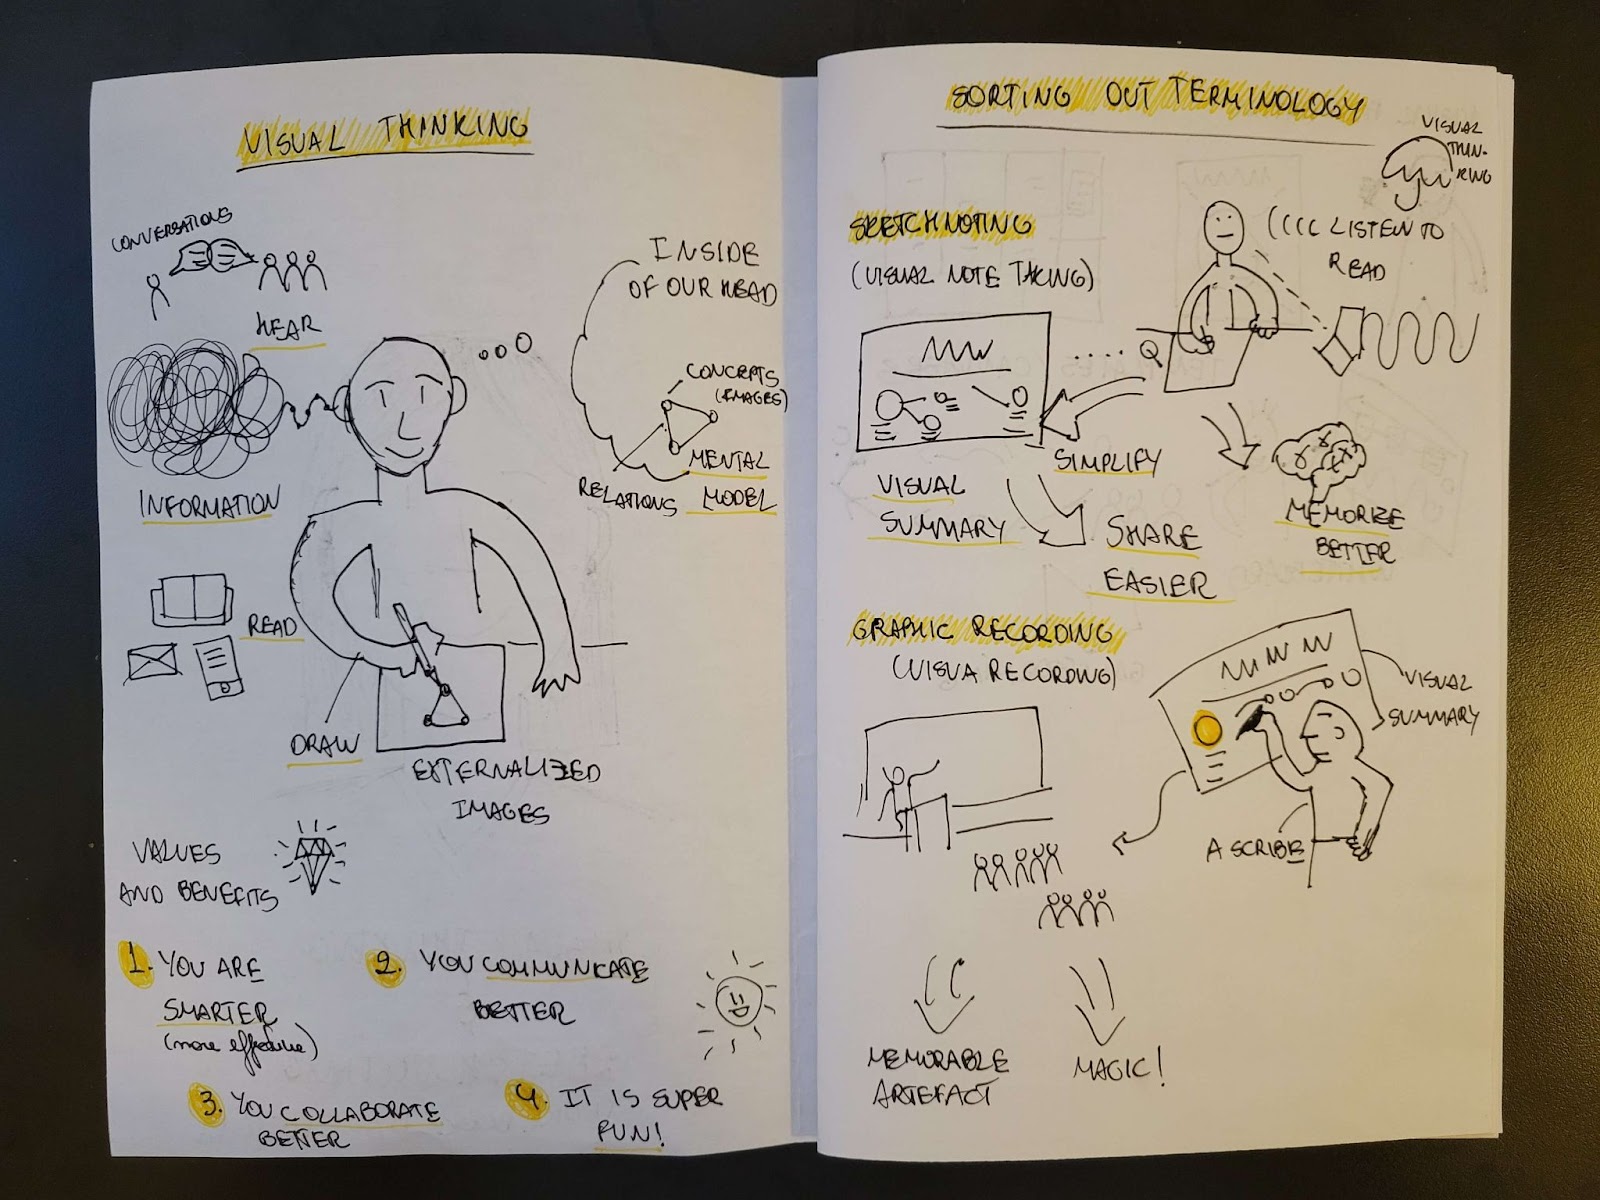
What do I mean by visual thinking? Let me show you:

As we receive information, our brains create mental models to interpret it through visualization (what is this?) and connection (how does this thing relate to this other thing?). When we present ideas visually, we’re effectively interpreting it at the same time. This makes it easier for others to understand, which in turn makes communication and collaboration easier and more productive.
The problem is that for many of us, myself included, visual thinking doesn’t come naturally. It’s hard to break away from our standard text and verbal communication—plus, it’s not like I’m an artist or graphic designer. But I like a challenge, so I decided to take a professional development class dedicated to improving visual thinking. Here are a few tips I picked up along the way.
During the class, we were instructed to take visual notes instead of writing. This is called sketchnoting, and it’s a low-pressure way to start tapping into the visual side of your brain. Personally, it helped me overcome my hesitation about drawing, and gave me valuable practice in distilling information into visual form.
Ultimately, sketchnoting can simplify complex information for your own benefit, as well as creating a visual summary that is easily shareable with others. The pages below are my sketch notes about iconography and scoping for mapping (more on mapping later). I could have written everything out, but with this, I can recall the concepts at a glance.

As a strategist, I often have to organize a lot of information and turn it into a navigable strategy. While I have processes for doing so, I had never thought of actually making a map to find my way. Creating a visual map can help you position facts in a strategic manner and explore potential solutions and next steps.
First, make visual representations of the facts and position them in relation to one another. It’s important to think of the elements as parts of a connected system, not individually, so you can understand the relationships and impacts of each on the whole and vice versa. Once you’ve done that, you can start testing ideas by asking “what if?” Swap the order of two elements and see what happens. Try adding or subtracting intermediate steps. You may be surprised at how many creative solutions you come up with when your analysis gets more creative.

Fun fact: there are five different types of lines. I didn’t think I needed to know that. But from dotted to hollow, lines and other directional elements are the best way to show relationships between information, triggers, and actions. This is especially helpful when you start mapping out complex conditional processes: If this happens, do that; if this other thing happens, do something else. Lines prevent confusion and emphasize the relationships between different items, as well as their relative importance and timing.
It’s easy to be intimidated by visual thinking exercises, especially when writing things down or speaking feels like second nature. However, if you stop feeling self-conscious about your drawing skills and focus on how much strategic thinking goes into note taking, you’ll appreciate it much more.
Next time you’re in a meeting, try sketchnoting to record what’s being said. Or, if you need to present an idea, make a visual map and use that as a starting point for discussion instead of emailing everyone an outline. It doesn’t matter if you’ll never win an art award—you just might find yourself, and what you are trying to communicate, a lot more effective.